|
BIRLA INSTITUTE OF SCIENTIFIC RESEARCH
Bioinformatics Workshop
on
"Bioinformatics Application in modelling and Drug Designing"
15 - 17 February 2018
Day1
Lab 1: Databases in Bioinformatics
Section - 1
Accessing Biological Sequences and Structure Databases
Objective
The objective of this exercise is to make students aware about the various biological informations & databases
available.
Here we will learn to access NCBI for nucleic and protein sequences and PDB for the structures of proteins.
Primary Biological Databases
NCBI - National Center for Biotechnology Information
- Division of the National Library of Medicine (NLM) at the United States National Institutes of Health
- Established in November of 1988 at Bethesda, Maryland, USA.
- http://www.ncbi.nlm.nih.gov/
EBI (European Bioinformatics Institute) - European Molecular Biology Laboratory (EMBL)
- EMBL (European Molecular Biology Laboratory) is Europe's flagship laboratory for the life sciences
- Established in 1980 at the European Molecular Biology Laboratory in Heidelberg, Germany in September 1994
- EMBL-EBI was firmly established at Wellcome Trust Genome Campus in Hinxton in the UK.
- http://www.ebi.ac.uk/about
DDBJ(DNA Data Bank of Japan) - National Institute of Genetics
- DDBJ Center collects nucleotide sequence data as a member of INSDC (International Nucleotide Sequence Database Collaboration)
- First asian Nucleotide Datababse Centre
- Actively working from 1986 at National Institute of Genetics, Japan.
- http://www.ddbj.nig.ac.jp/
Protein Data Bank (structure db)
- Single worldwide repository of information about the 3D structures of large biological molecules, including proteins and nucleic acids.
- The data, typically obtained by X-ray crystallography or NMR spectroscopy
- Established in 1971 at Brookhaven National Laboratory
- In 1998, the Research Collaboratory for Structural Bioinformatics (RCSB) became responsible for the management of the PDB.
- http://rcsb.org/pdb/home/home.do
- PDB database actively available as:
- RCSB PDB: USA
- PDBe: Europe
- PDBj: Japan
PubChem
PubChem, released in 2004, provides information on the biological activities of small molecules.
PubChem is organized as three linked databases within the NCBI's Entrez information retrieval system.
These are PubChem Substance, PubChem Compound, and PubChem BioAssay.
PubChem also provides a fast chemical structure similarity search tool.
PubChem
https://pubchem.ncbi.nlm.nih.gov
DrugBank Version 5.0
PubChem, released in 2004, provides information on the biological activities of small molecules.
PubChem is organized as three linked databases within the NCBI's Entrez information retrieval system.
These are PubChem Substance, PubChem Compound, and PubChem BioAssay.
PubChem also provides a fast chemical structure similarity search tool.
3.DrugBank Version 5.0
https://www.drugbank.ca/
Sequence Alignment Using BLAST
Section -2
Basic Local Alignment Search Tool (BLAST) is a dynamic programming algorithm for sequence alignment.
It is
based on smith-waterman algorithm, means on the concept of local alignment.
For an alignment blast uses a
query sequence which is taken for the alignment and one or more subject seqeunces on which the query sequence
is aligned.
| Nucleotide Blast |
Search a nucleotide database using a nucleotide query |
| protein blast |
Search protein database using a protein query |
| blastx |
Search protein database using a translated nucleotide query |
| tblastn |
Search translated nucleotide database using a protein query |
| tblastx |
Search translated nucleotide database using a translated nucleotide query |
Here we will go for alignment of nucleotide query sequence i.e. Human Insulin with complete
nucleotide database.
STEPS:
- Open BLAST tool
Link is :http://blast.ncbi.nlm.nih.gov/Blast.cgi
- Click on nucleotide blast (blastn).
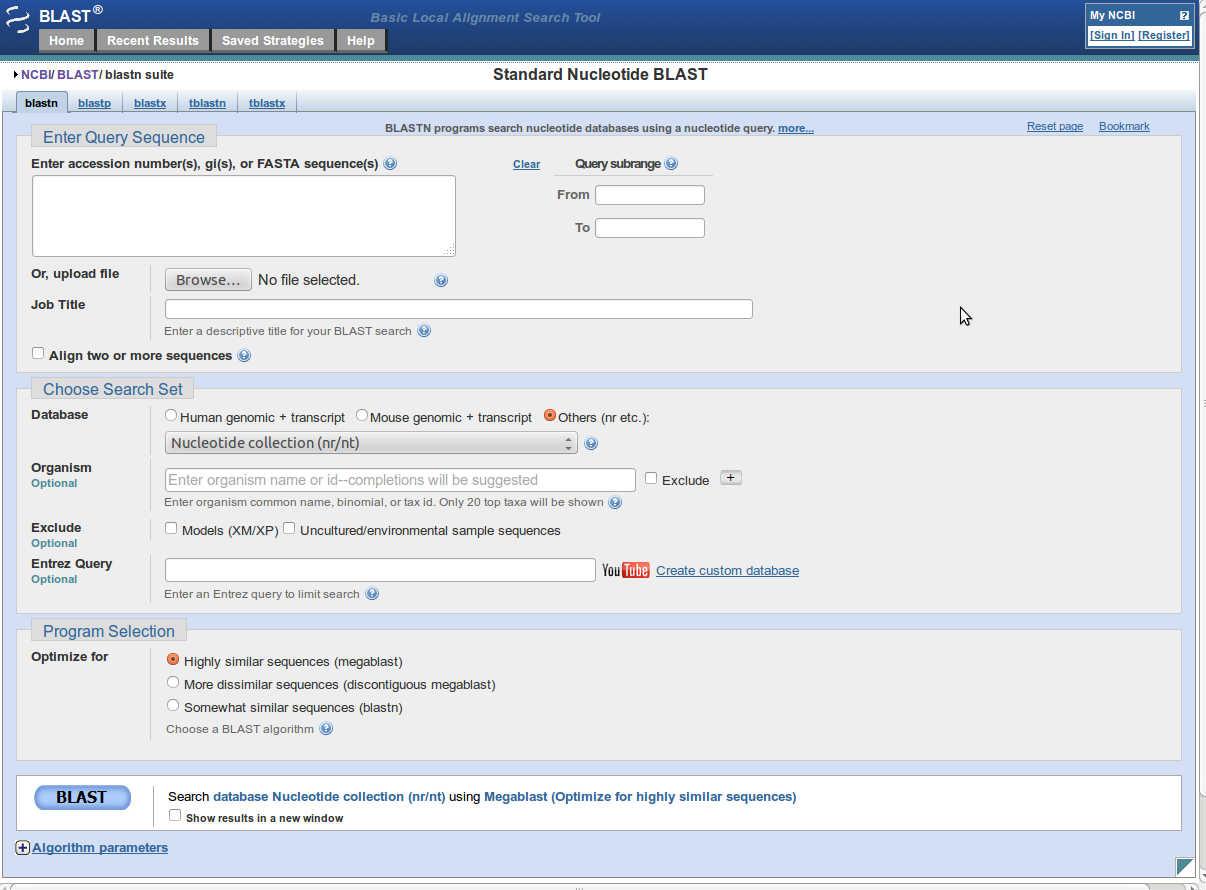
- Enter fasta sequence or GI number or accession number of query sequence into 'Enter Query Sequence'.
- You can set further parameters for blast.
- The parameters set there are default, if any change is made in these parameters, a light yellow strip
is displayed under that parameter.
- After setting up all the parameters click on 'BLAST' button to run blast.
- This will take to the result page in some time.
Result page of BLAST
Result inculudes graphics summary, descriptions, dot plots, alignment, scores etc.
In graphics summary result is shown as different color showing a range of percent similarity score.Towards
black color, less alignment score means less similarity and towards red color more alignment score means
more similarity.
The very first red strip below the range strip with numbers below show the query sequence with its length.
After that all colored lines show alignment of query sequence with various (subject) sequences available in
database.
After that description of subject sequences are given. It includes name of subject sequence, scores,
indentity with query, e-value and the link of subject sequence.
After 'Description' alignment of query sequence with various subject sequences are given. It shows base to
base alignment with matches, mismatches and gaps as well.
Section - 3
[A.] Visualization of Protein using RasMol
Introduction
Rasmol is a computer program written for molecular graphics visualization intended
and used primarily for the depiction and exploration of biological macromolecule
structures.
Getting Started
- Start Rasmol from your computer's Dektop.
- This will open two Windows (one Black window, another white command-line window)
- Commands below preceded by M are best done from the pull-down Menus. Command NOT preceded by M
must be typed in the white command-line window. (RasMol has two windows, one black and one white. On
windows, the white command-line window starts minimized. look for it on the taskbar. Command with blue
colour listed below seprated by semicolons should be typed on separate lines into the white window,
pressing Enter after each command.
- Run RasMol, and do M(enu) File-- Open. Select 1d66.pdb(gal4 transcriptional regulator complexed to DNA).
- How many Chains are there?
- reset; rotate z 90; zoom 150; rotate y 40
- M(enu) Display-- Backbone, M colours-- Chain
(Now each chain in different colour. Click on each chain to report its ID letter code)
- Is there anything else in this PDB file besides the protein/DNA chains?
- select hetero; M Display—Spacefill
(Now you can see oxygen from water in the X-rayed crystal.)
- M Colours-- CPK
- Restrict not water
(This hides water; Click on what remains to find out what it is.)
- What are the hydrophobic aminoacids?
- select hydrophobic; color magenta; wireframe 0.4; select not water
- M Display-- Spacefill; M Option-- Slab mode
- What holds the CD ions in place?
- M Display-- Backbone; M Colours--Chain
- select cd; M Display-- Spacefill; M Colours-- CPK
- select within(2.6, cd)
(This selects all atoms within 2.6 Angstroms of the Cd++ ions)
- M Display-- Spacefill; M Colours-- CPK
- save script myview1.spt; M File-- Close; script myview1.spt
(Restore script)
- Where are the alpha helices and beta strands?
- M Edit-- Select all; M Display-- Backbone; M Colours-- Structure
(This colors alpha helices purple, and beta strands yellow (there aren't any beta strand in 1d66.pdb) Turns appear blue).
- How do I find distance between two atoms?
- M Display-- Spacefill; set picking
(Now click on two atoms, and watch the report in command line window)
- set picking monitor
(Now click on two atoms and watch report at graphic window)
- color monitor white; set monitor off; monitor off; set picking ident.
- How do I see the inside of a molecule?
- Don't rotate the molecule with mouse at any time during this sequence.
- reset; M Edit-- Select All; M Display-- Spacefill; M Colour-- Chain.
- rotate x 83; zoom 200; M Option-- Hetero Atoms
(Toggle off waters)
- select dna; color cpk; M Option-- Slab Mode
(Toggle on slab mode)
- slabmode section;
(Now only cut face is shown)
- slab 76
(Now you can see GC base pair).
- slab 68
- How do I keep the DNA from rotating off screen?
- reset; restrict dna; rotate z 90;
(Try rotating around the axis of the DNA helix, move the mouse up and down)
- center selected
(Now try again and notice the difference).
- How do I get multiple representation of the same atoms?
- restrict :d; M Colours-- CPK
(:d means all atoms in chain D)
- M Display-- Backbone, M Display-- Ball & Stick
- backbone 1.
(Be sure to include the decimal point after the 1, which make RasMol interpret it as Angstroms)
- spacefill off; wireframe 0.5; wireframe 0.1; spacefill 0.3; backbone 0.1; zoom 500
- How do I label an atom?
- set picking label
(Now click on a few atoms)
- color labels white; label off; set picking ident
(Click on an atom and notice its own ID number(3rd word in the report). We'll refer to the number as ### in the command below)
- select atomno = ###; label "My Favorite atom"; label off
- How do I see the molecule in stereo?
- M Option-- Stereo; stereo -5
- Where are the disulphide bonds?
- M Display-- Wireframe; ssbonds 0.8; color ssbonds yellow
- M Edit-- Select All; M Display-- Backbone; M Colour-- Chain
- set ssbonds backbone
- Where are the hydrogen bonds?
- M Edit-- Select All; M Display--Backbone; M Colour-- Structure
- restrict helix; backbone 0; hbonds 0.5; color hbonds white
- set hbonds backbone; hbonds off; restrict sheet; restrict not (helix or sheet)
- Some powerful command with select
- select single Amino acid----use three letter abbreviation like lue27.
Example select lue27
- Amino acid type........... abbreviation like aa type
Example select asp
- Entire molecule
Example select *
- Chain -select *chain letter
select *A
- Select protein and select not protein.
- Molecule description with show command.....
- show information
- show selected
- show sequence
- Slab mode.......
- Allows you to look at internal regions of the molecule, by slicing on the z axis.
- Zero is define as behind the molecule and 100 is defined as in front of the molecule.
- slab 0-100, example slab 50 cuts at approximately the mid line of the molecule.
- Stereo Command..........
- Provides side by side display of the molecule.
- Make sure entire molecule is selected
- Ras MOL>stereo.
- On and Off commands..........
| Command | Action |
|---|
| wireframe on/off | Display wireframe |
| wireframe 0.2 | Display stick bonds of radius 0.2 |
| backbone on/off | Display CA backbone only |
| backbone 0.2 | Display CA backbone as sticks of radius 0.2 |
| spacefill on/off | Atoms as spacefill spheres |
| spacefill 1.0 | Atoms as spheres of radius 1.0 |
| ribbons on/off | Display molecule ribbons |
| ribbons 1.0 | Display molecule ribbons, width 1.0 |
| cartoon on/off | Display protein cartoon |
| dots on/off | Display dot-surface about all atoms |
| dots 10 | Display low-density dot-surface |
| hbonds on/off | Display hydrogen bonds |
| hbonds 0.1 | Display hydrogen bonds, radius 0.1 |
| set axes on/off | Display coordinate axes |
| set boundbox on/off | Display bounding box |
Section - 4 Protein Structure Prediction: Homology Modeling
Steps:
- Take a protein sequence in FASTA format whose structure is to be modelled. This is our 'Target Sequence'.
- Now go to the webpage http://swissmodel.expasy.org/
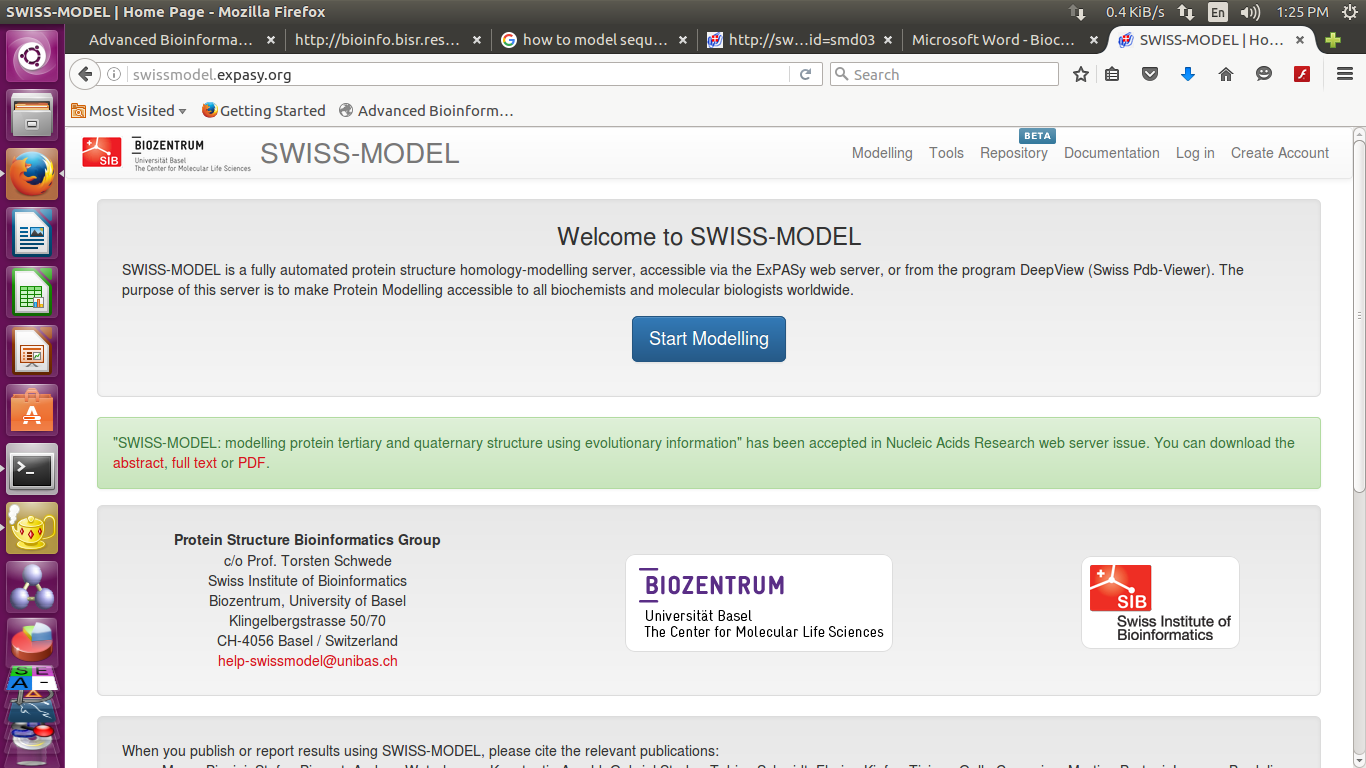
- Paste target sequence into swiss model workspace in FASTA format
(you can also upload target sequence )
you can provide a Project title and email-id-
You have 2 options now
you can either search for templates or build models directly
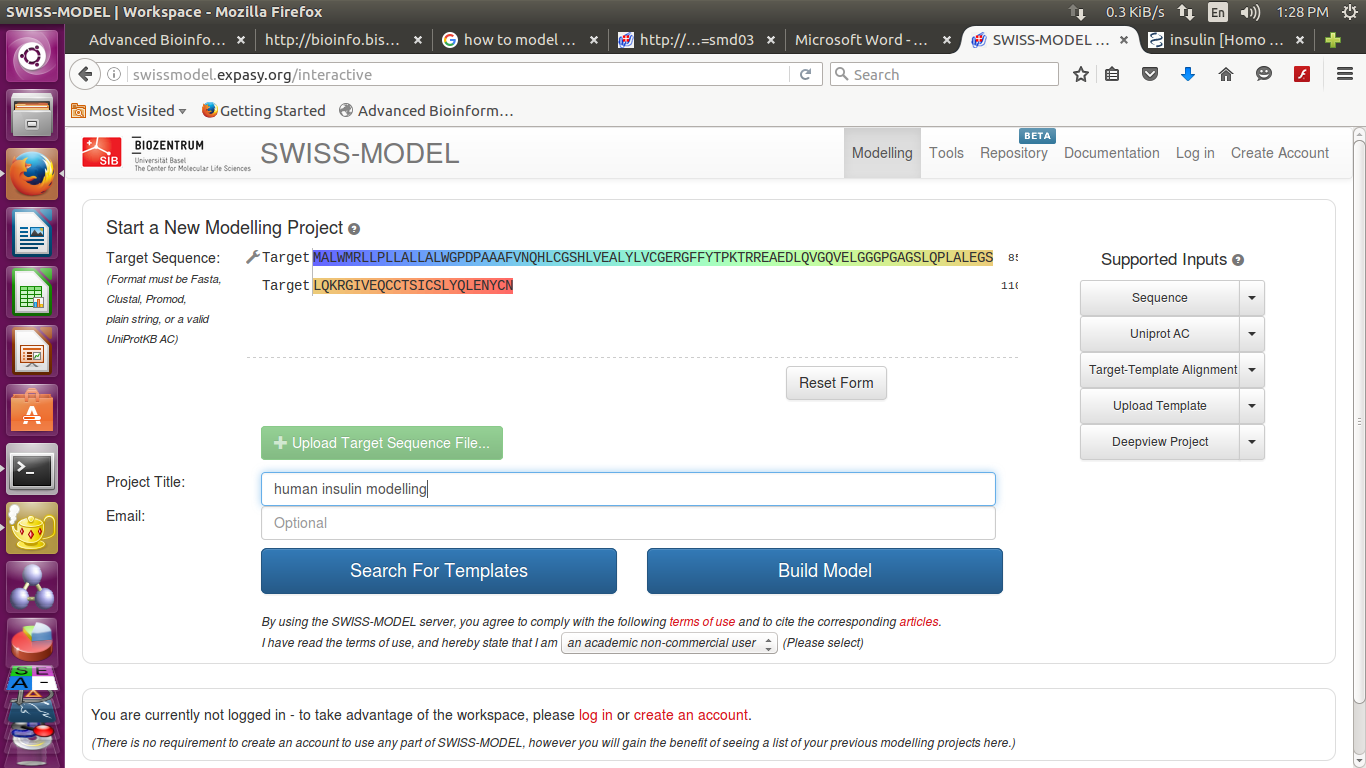
Press the button 'build model'.
- you can see result after a while
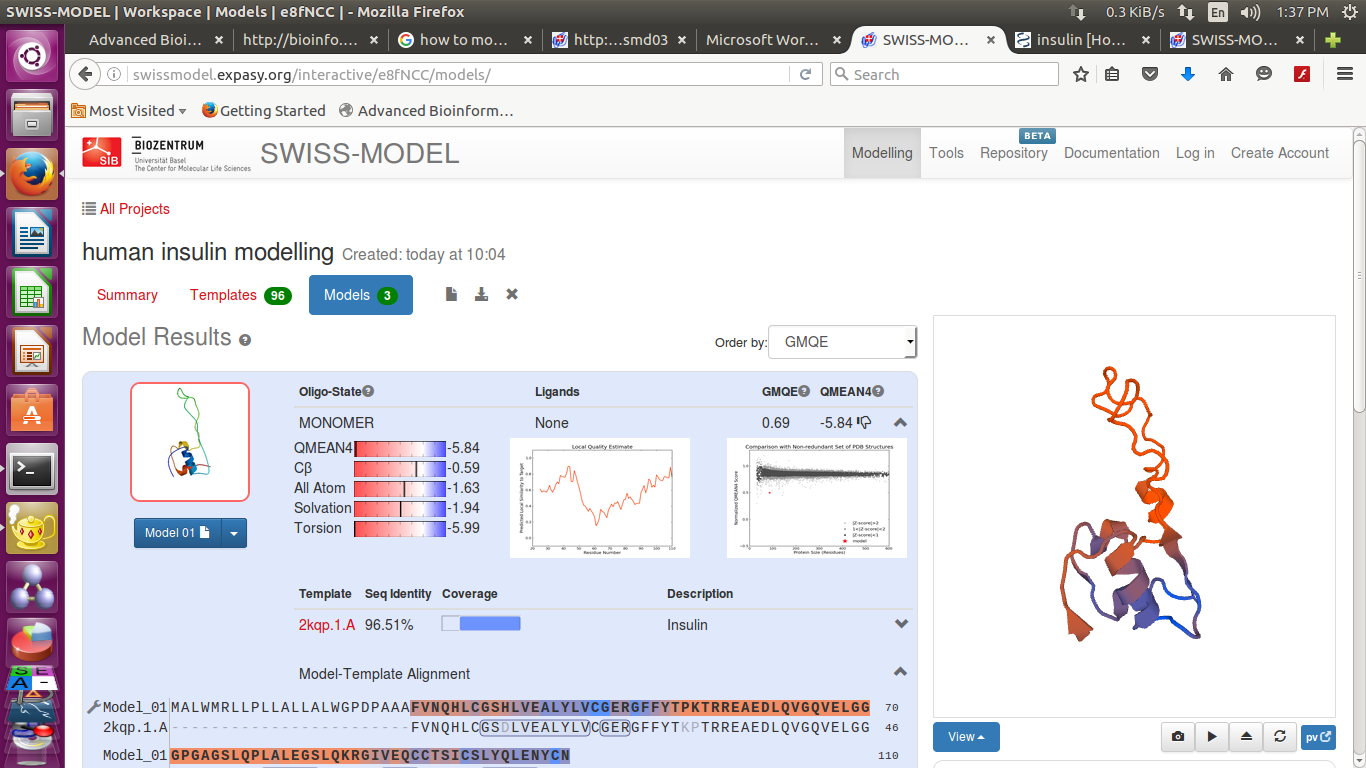
Swissmodel provide 3 best results according to their score
It provide-
Sequence identity,
Alignment
and Structure
- We can also download the detailed results
Section - 3: Protein Structure Validation
The Structure Analysis and Verification using SAVES Server
Steps:
- Open SAVES SERVER webpage:
http://services.mbi.ucla.edu/SAVES/
- Upload the PDB file.
- RUN all programs
Homology Modeling using Chimera
- 3. Open target sequence into chimera
(File -> Open -> (select target file from file browser)
or can download target sequence online by-
File -> Fetch by ID (provide ID related to given databases)
This step opens target protein sequence into 'sequence viewer'.
- 4. To view secondary structures in this target sequence
go to (in 'sequence viewer')
Structure -> Secondary Structure -> Show Actual/ Show Predicted
- 5. To show/hide these structures in 'sequence viewer'
go to (in 'sequence viewer')
Info -> Region Browser
- 6. Template Sequence Search
To model structure of this target protein firstly a known structure protein sequence is searched which is much
similar to this target sequence. For this Blast is performed and target sequence is aligned with PDB database's
protein structures. We take a much similar sequence (with having low resolution parameter) known
as 'Template Sequence'.
Following process is followed for the same-
go to (in 'sequence viewer')
- a) Info -> Blast Protein
- b) select target protein and click OK
- c) Select program 'blast' and database 'pdb' ( can enter desired E-value and Matrix used for BLAST ) and click OK
This opens results of BLAST search. Click on 'Columns' buttons to view desired parameters in results by selecting the options. Check 'Resolution' to view resolution of proteins given.
- 7. View alignment of target sequence to blast results
For this, select a protein from results and click on 'Show in MAV'.
(MAV stands for MultAlign Viewer)
- 8. Loading Template Structure into 'Chimera'
Select a best hit template protein from above results and click on 'Load Structure'.
- 9. Modelling Structure of template sequence
go to (in 'MultAlign Viewer')
|

